Marble Ramp Lab
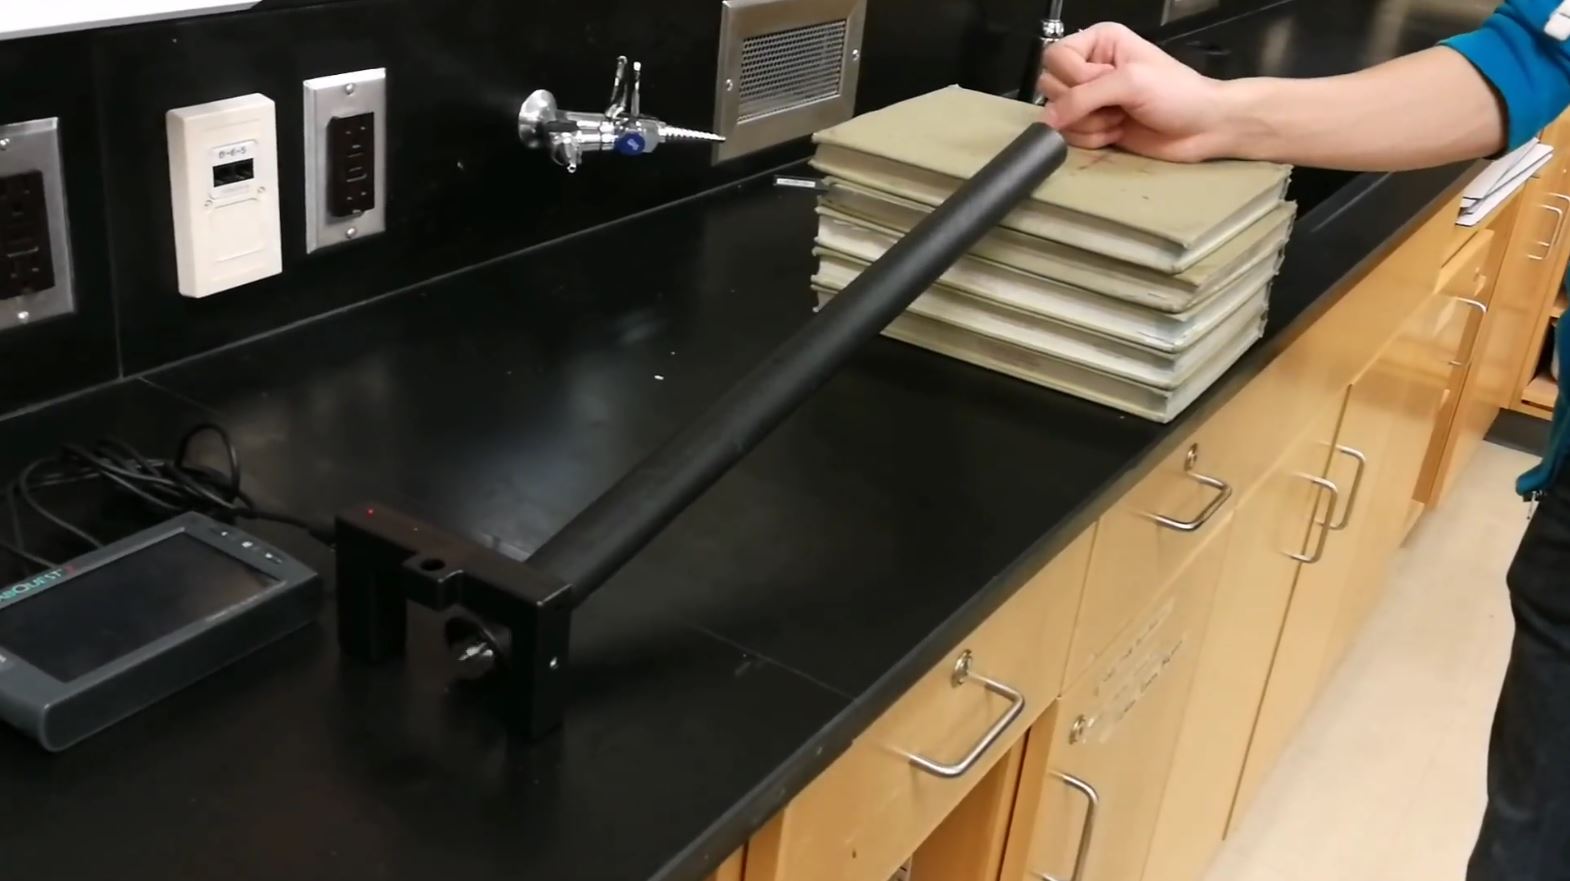
Last Wednesday, we conducted an experiment to investigate the relationship between the velocity of a marble after rolling down a slope and the height of the ramp! The goal of the experiment was to answer the question: “How does the height of the ramp affect the velocity of a marble after rolling down its slope?”
Today, I analyzed the data we got from the experiment and discovered new knowledge based solely on experimental information, rather than through a lesson. Here are the results of the lab and what I learned through the process:
1) The square of the final velocity of a marble after rolling down a ramp has a positive proportional relationship with the starting height of the marble. Also, the final velocity of a marble after rolling down a ramp has a positive proportional relationship with the square root of the starting height of the marble.
In other words, as you increase the starting height of the marble, the final velocity of the marble after rolling down the ramp increases quadratically.
In the experiment, it was found that the relations were not directly proportional; the trendline equations did not pass through the origin.
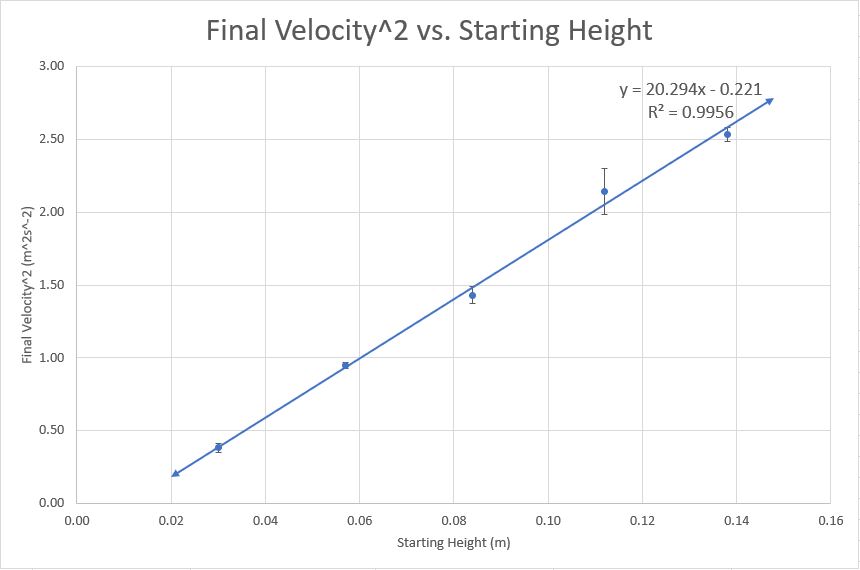 Figure 1: Scatter plot graph of final velocity squared compared to the starting height of the marble.
The trend line is linear, with an equation of v2 = 20.3h - 0.22.
Figure 1: Scatter plot graph of final velocity squared compared to the starting height of the marble.
The trend line is linear, with an equation of v2 = 20.3h - 0.22.
2) We can use conservation of energy principles to find what the mathematical relation between final velocity and starting height should be:
Ek initial + Eg initial = Ek final + Eg final
½mvinitial2 + mghinitial = ½mvfinal2 + mghfinal
½m(0)2 + mghinitial = ½mvfinal2 + mg(0)
mghinitial = ½mvfinal2
2ghinitial = vfinal2
(2ghinitial)1/2 = vinitial
As it is seen here, it’s either velocity is proportional to the square root of height, or the square of velocity is proportional to the height.
This equation also lets us find the experimental value of acceleration due to gravity once we’ve found the ratio of final velocity to initial height through graphing the data.
Finding experimental value of acceleration due to gravity using equation from figure 1:
Eg = Ek ; Eg = mgh, Ek = ½mv2, v2/h = 20.3 ms-2
mgh = ½mv2
g = ½v2/h
g= ½(20.3 ms-2)
g = 10.2 ms-2
The experimental value is somewhat off from Earth’s theoretical value of acceleration due to gravity, and we can calculate the percentage error to see by how much it is off:
| % error = | theoretical - experimental | /theoretical |
| % error = | gearth - gexperimental | /gearth |
| % error = 100 * | 9.81 ms-2 - 10.15 ms-2 | /9.81 ms-2 |
% error = 3.47%
The percentage error of the experiment was 3.47%. This shows us how well we conducted the experiment and since 3.47% is fairly low, I would say that it was a success.
3) When conducting an experiment, a variety of sources of error can have an impact on your data. A few of them can be controlled, but the rest are simply too hard to control within the time constraints of the experiment or are not physically possible. For example, we can control the mass of the marble and the material of the surface, which could possibly have an impact on the experiment. However, we do not have the resources to setup a robotic system to replace the human hand in dropping the marble (which would control initial velocity and initial height of the marble to a very precise degree), nor can we eliminate friction.
Some sources of error are systematic, which means that they will skew every single point of data in your collected data in the same way. In this experiment, the placement of the Labquest photogate set a certain distance for the marble to slow down from friction, reducing the final velocity of every single data point. Systematic errors reduce the accuracy of your experiment: how close you were to the truth.
Other sources of error are random, which means that they will randomly increase or decrease the value of each point by a different amount every time. In this experiment, the initial placement of the marble at the top of the ramp increased or decreased the initial velocity and initial height of the marble for each trial, which in turn affected the final velocity of the marble. Random errors reduce the precision of your experiment: how consistent and detailed your results were.
All labs should yield meaningful information, and this new information should always prompt new questions. This marble ramp lab was no exception.
1) The equation found using conservation of energy principles revealed that the square of the final velocity was directly proportional to the starting height. However, the experimental equation found that the square of the final velocity was not directly proportional to the starting height. Why is that? Does the theoretical equation not apply to this experiment, or is it because of the error in our experiment?
2) In addition to the graph between the square of the final velocity and the starting height, I also graphed the final velocity and the square root of the starting height. However, I noticed a discrepancy between the experimental value of acceleration due to gravity when using the two different equations.
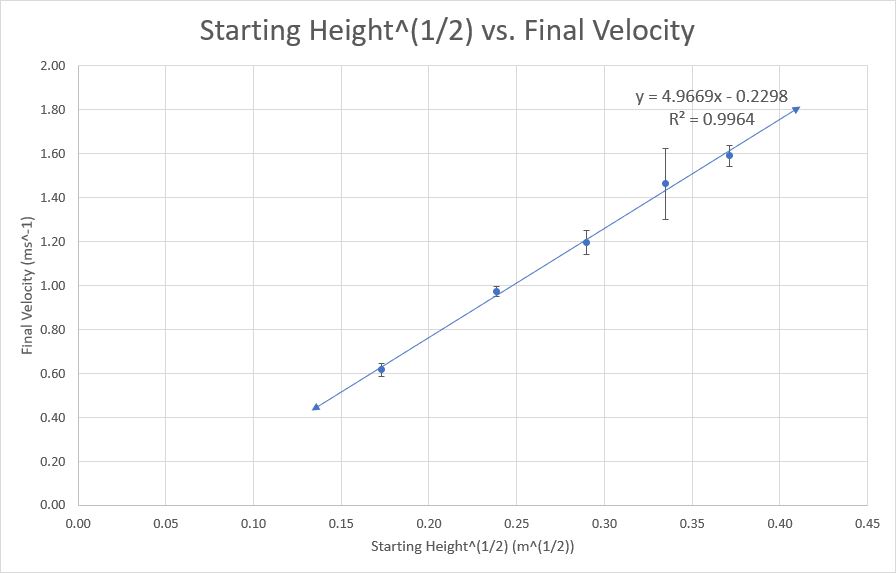 Figure 2: Scatter plot graph of final velocity compared to the square root of the starting height of the marble. The trend line is linear, with an equation of v = 4.97h1/2 - 0.23.
Finding experimental value of acceleration due to gravity using equation from figure 2:
Eg = Ek ; Eg = mgh, Ek = ½mv2, v/h1/2 = 4.97 m1/2s-1
mgh = ½mv2
g = ½v2/h
g = ½v/h1/2
g= ½(4.97 m1/2s-1)2
g = 12.4 ms-2
12.4 ms-2 is the experimental value of acceleration due to gravity using figure 2, but 10.2 ms-2 is the experimental value of acceleration due to gravity using the equation from figure 1.
Why are these two values different? Was using the equation from figure 1 to find experimental value of acceleration due to gravity the correct choice?
Something I found intriguing while conducting this experiment was how the Labquest photogates worked. They shoot a beam between their two posts! When an object passes through the beam, the Labquest calculates the velocity with the time the object blocked the beam and the diameter of the object. It’s awesome how our technology is fast enough to be able to calculate values using only a very short moment of time!
After Unit Reflection
Solving Energy Transformation Problems
In this blog post, I solved the main energy transformation problem of the lab: converting gravitational potential energy into kinetic energy! I used the law of conservation of energy to relate the initial height of the ramp to the square of the final velocity of the marble. With the data from the experiment, I solved for the experimental value of gravity in the energy transformation by substituting the slope of the graph as the ratio between the square of the velocity and the height. I also did the same thing again but related the square root of the initial height of the ramp to the final velocity of the marble.